
Master Crypto Chart Patterns for Smart Trading Success. In the ever-changing world of cryptocurrency, traders rely on tools and strategies to anticipate market moves. One of the most effective tools is the study of crypto chart patterns. These patterns, formed by price movements over time, help traders spot potential reversals, continuations, and breakout opportunities.
Whether you’re a beginner hoping to understand Bitcoin’s swings or a seasoned investor analyzing altcoins, mastering crypto chart patterns can dramatically improve your decision-making. In this guide, we’ll explore the most important patterns, how to identify them, and how to use them effectively.
Why Crypto Chart Patterns Matter
Unlike random price changes, crypto chart patterns emerge from repeated human behavior in trading markets. Fear, greed, and speculation drive the market, and these emotions often manifest in recurring visual structures.
Patterns allow traders to:
- Identify trend direction
- Predict potential breakouts or breakdowns
- Determine entry and exit points
- Manage risk more effectively
When used alongside other tools like technical indicators, these patterns can be powerful for spotting profitable trades.
Types of Crypto Chart Patterns
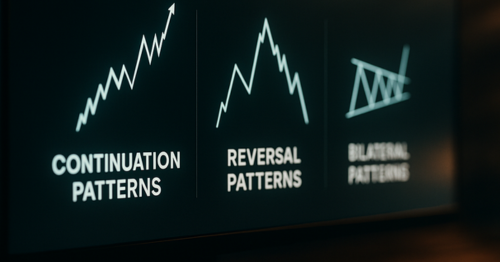
Broadly, crypto chart patterns fall into three main categories:
- Continuation Patterns – Indicate the trend will likely continue after a brief pause.
- Reversal Patterns – Suggest the current trend is about to change direction.
- Bilateral Patterns – Indicate the market could move in either direction depending on the breakout.
Let’s explore each category in detail.
1. Continuation Patterns
Continuation patterns signal that the price is likely to resume its existing trend after a consolidation phase.
- Ascending Triangle
This bullish pattern forms when the price makes higher lows but meets resistance at a specific level. A breakout above resistance often signals the trend will continue upward. - Flag Pattern
A short-term consolidation that resembles a rectangle or slanted channel. Flags often appear after a strong price move and signal continuation. - Pennant Pattern
Similar to a flag but with converging trend lines, forming a small symmetrical triangle. Pennants follow a strong price surge and suggest continuation.
2. Reversal Patterns
Reversal patterns indicate that the existing trend is losing momentum and a change is coming.
- Head and Shoulders
This is one of the most reliable bearish reversal patterns. It features three peaks — a higher one in the middle (head) and two lower peaks (shoulders). A break below the neckline confirms the reversal. - Double Top
Two equal highs followed by a breakdown signal the end of an uptrend. - Double Bottom
The opposite of the double top, this pattern signals the end of a downtrend and potential upward movement.
3. Bilateral Patterns
Bilateral patterns show that the market could move either way depending on the breakout.
- Symmetrical Triangle
Prices converge toward a point, and a breakout can occur in either direction. - Wedge Patterns
Rising wedges are generally bearish, while falling wedges are usually bullish.
How to Trade Using Crypto Chart Patterns
To trade effectively with crypto chart patterns, follow these steps:
- Identify the Pattern
Use reliable charting platforms and switch to different time frames to confirm the formation. - Wait for Confirmation
Don’t trade until the breakout is confirmed with strong volume. - Set Stop Losses
Protect your capital by setting stop losses at logical levels. - Combine with Indicators
Use RSI, MACD, or moving averages to confirm your analysis.
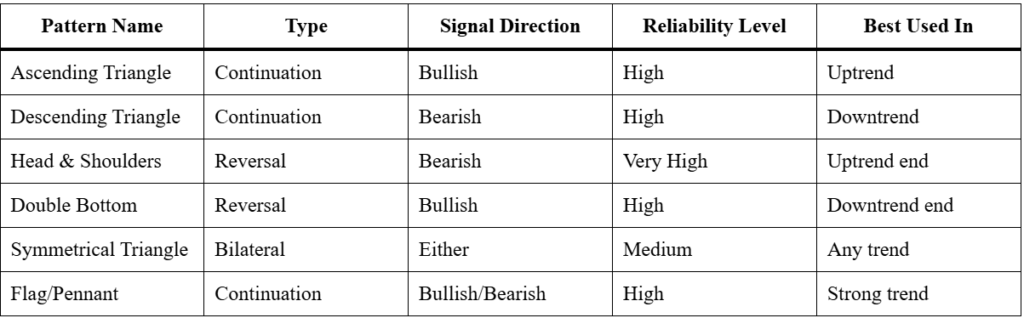
Comparison Table of Key Crypto Chart Patterns
Common Mistakes When Using Crypto Chart Patterns
Even with knowledge of crypto chart patterns, traders often make costly mistakes:
- Entering too early without confirmation
- Ignoring volume, which is critical for validating breakouts
- Forgetting stop losses, leading to large losses
- Relying solely on patterns without checking market news or indicators
Advanced Tips for Mastering Crypto Chart Patterns
Once you’re comfortable with the basics, you can refine your trading by:
- Studying multiple timeframes – A pattern on a 4-hour chart may look different on a daily chart.
- Tracking pattern success rates – Keep a trading journal to note which patterns work best for you.
- Watching for fakeouts – Not all breakouts lead to sustained moves; be ready to exit quickly if the market reverses.
Real-World Example
Imagine Bitcoin is in an uptrend and forms an ascending triangle. The resistance level sits at $30,000, and higher lows keep pushing the price upward. Once volume spikes and price breaks above $30,000, this confirms the bullish continuation pattern. A trader could enter at $30,100, set a stop loss at $29,500, and target $31,500.
Final Thoughts
Learning crypto chart patterns is like learning a new language at first, it feels complex, but with practice, you begin to understand the market’s “words” and “sentences.” These patterns offer traders a powerful way to interpret market movements, plan trades, and manage risk.
However, no single tool guarantees success. Combining pattern recognition with technical indicators, fundamental analysis, and disciplined risk management is the best way to thrive in crypto trading. With time and practice, you’ll learn to read the market’s hidden signals and make confident trading decisions.
Frequently Asked Questions (FAQs)
1. What are crypto chart patterns?
Crypto chart patterns are visual formations on cryptocurrency price charts that traders use to identify potential market trends and make informed trading decisions. They often indicate whether a price will continue its current trend or reverse direction.
2. Why are crypto chart patterns important for traders?
Crypto chart patterns help traders predict market moves by recognizing price trends, reversals, and breakouts. This knowledge allows for better entry and exit points, reducing risks and improving profit potential.
3. Can beginners learn crypto chart patterns easily?
Yes, beginners can learn crypto chart patterns with practice. Starting with simple patterns like triangles, head and shoulders, and double tops/bottoms can build a strong foundation before tackling more advanced patterns.
4. Are crypto chart patterns always accurate?
No, crypto chart patterns are not always 100% accurate. They work best when combined with other tools like technical indicators, volume analysis, and market sentiment for a more reliable trading strategy.
5. How do I start using crypto chart patterns in trading?
Start by studying basic chart patterns and practicing on demo accounts before risking real money. Use reputable charting tools, track your trades, and continually refine your strategy based on your results.

I’m a passionate content writer who loves crafting clear, engaging, and user friendly content that connects with readers. From blog articles to web copy, I create words that inform, inspire, and leave a lasting impact