
Introduction: Crypto Trading
Crypto Trading Deep Dive: Crypto trading is one of the most dynamic financial activities today. Whether you’re just getting started or looking to sharpen your edge, this guide offers a complete deep dive into trading concepts, from basic market structures to chart analysis, risk management, and more.
Foundations of Crypto Trading
Crypto trading might seem complex at first glance, but once you understand the foundational concepts, you can confidently navigate the digital markets. This section breaks down the basics, from understanding the core difference between trading and investing to exploring how the market functions and the tools traders use.

Introduction to Trading and Investing
While commonly mistaken as the same, trading and investing differ significantly in their objectives, time horizons, and strategic approaches.
- Investing is the practice of buying assets and holding them for the long term, expecting them to grow in value over time. Investors in crypto might buy Bitcoin or Ethereum and hold it for years, believing in their long-term potential.
- Trading, on the other hand, involves buying and selling crypto over shorter timeframes to profit from market volatility. Traders focus on timing, entering and exiting positions based on short-term price movements.
In short:
- Investors look at the bigger picture.
- Traders react to short-term trends.
Both approaches can be profitable, and many individuals choose to do a mix of both based on their risk tolerance, capital, and goals.
Financial Market Analysis
To make smart decisions in the crypto market, you need to analyze it. There are two primary types of analysis:
Fundamental Analysis (FA)
This approach emphasizes assessing the intrinsic worth of a cryptocurrency based on its fundamentals and real-world utility. For example:
- What problem does the crypto project solve?
- Is the team credible?
- How is the tokenomics structured?
- Are there upcoming partnerships or upgrades?
FA is especially important for long-term investors who are trying to find undervalued projects with high growth potential.
Technical Analysis (TA)
This focuses on price charts, volume, and indicators to predict future price movements. TA is widely used by traders to time their entries and exits based on patterns and signals.
While FA helps understand what to buy, TA helps with when to buy or sell.
Market Dynamics
Understanding how the crypto market works is essential before risking any capital. The market is driven by:
- Supply and Demand: When demand for a token increases while supply remains limited, its price tends to rise accordingly. The more supply, the lower the price, unless demand rises too.
- Liquidity: This measures how quickly and efficiently a coin can be bought or sold in the market without causing major price fluctuations. More liquidity means better execution and tighter spreads.
- Market Sentiment: Fear, greed, and hype often drive prices more than logic. Sentiment can be gauged using tools like the Fear & Greed Index or social media trends.
- Volatility: Crypto is highly volatile, meaning prices can swing dramatically within short periods. This creates both opportunities and risks for traders.
Being aware of these forces helps you stay grounded during market swings and plan your moves accordingly.
Financial Instruments
Crypto trading offers multiple financial instruments, tools that allow you to interact with the market in various ways. These include:
Spot Trading
You buy and sell actual crypto assets, like BTC, ETH, or MATIC. It’s simple and suitable for beginners.
Futures Contracts
These instruments enable traders to bet on an asset’s future price movements, often using leverage to increase potential gains, and risks. While profits can be high, so are the risks.
Options
Options provide the flexibility to buy or sell an asset at a predetermined price within a set timeframe, without being required to execute the trade. They’re more complex but useful for hedging.
ETFs and Tokenized Assets
Some platforms offer tokenized versions of traditional stocks or ETFs, allowing crypto users to gain exposure to non-crypto assets without leaving the blockchain ecosystem.
Read All About: Crypto Tokens
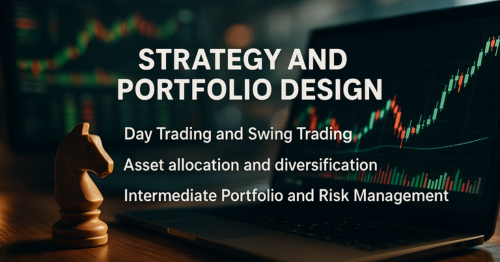
Strategy and Portfolio Design
Success in crypto trading isn’t just about picking the right coins, it’s about having a clear plan and managing your assets wisely. This section explores practical strategies like day and swing trading, along with vital concepts such as asset allocation, diversification, and risk management. Whether you’re just starting or refining your game plan, these tools will give you a solid edge in the crypto market.
Day Trading and Swing Trading
When diving into trading, it’s essential to understand different approaches based on timeframes and market behavior. The two most popular short-to-medium-term strategies are day trading and swing trading.
Day Trading: Fast-Paced and Precision-Driven
Day trading refers to the practice of entering and exiting positions in crypto assets within a single trading day to capitalize on short-term price movements. It demands close monitoring of the market, often down to the minute or hour. The idea is to profit from small price movements by making multiple trades daily.
- Time Required: High-requires continuous attention.
- Common Tools: Traders often rely on real-time candlestick charts, volume indicators, and Bollinger Bands to analyze market trends and make informed decisions.
- Risk Level: High due to rapid market shifts.
This method is best suited for individuals with time, experience, and a high tolerance for market stress.
Swing Trading: Riding Market Waves
Swing trading, in contrast, takes advantage of price swings over several days or weeks. Traders analyze broader trends and aim to capture medium-term gains.
- Time Required: Moderate-review charts once or twice daily.
- Common Tools: Moving averages, support/resistance levels, RSI.
- Risk Level: Lower than day trading but still volatile.
Swing trading is ideal for beginners because it allows time for analysis without the pressure of making split-second decisions.
Asset Allocation and Diversification
Crypto portfolios should never be based on hype or emotion. Wise investors prioritize asset allocation and diversification as key strategies to minimize risk and enhance long-term returns across their portfolios.
Asset Allocation: Spreading Capital Wisely
Asset allocation means deciding how to divide your total capital among different types of crypto assets based on your financial goals and risk appetite.
Example breakdown:
- 50% in blue-chip assets (e.g., BTC, ETH)
- 25% in altcoins with strong fundamentals (e.g., Chainlink, Polkadot)
- 15% in stablecoins (e.g., USDT, USDC) for liquidity
- 10% in emerging or high-risk tokens (e.g., meme coins, ICO projects)
This strategy creates a balanced approach by maintaining a stable core portfolio while allocating a portion to higher-risk assets for potential growth.
Diversification: Reducing Risk Exposure
Diversification is about investing in different asset categories to avoid heavy losses if one sector crashes.
- Across sectors: DeFi, NFTs, AI, L1 chains, privacy tokens
- Across platforms: Don’t keep all your funds on one exchange or Wallet
- Across risk levels: Blend low-risk assets with higher-risk, high-reward opportunities
A diversified portfolio cushions your capital during market volatility and increases long-term survival.
Intermediate Portfolio and Risk Management
Building a portfolio is just the beginning. Managing it smartly is what keeps you in the game, especially during volatile times.
Position Sizing: Control the Stakes
One of the golden rules of trading is to never invest too much in a single position. Many experienced traders recommend risking only 1–2% of your capital per trade. This strategy prevents major losses and protects your overall portfolio.
Risk-Reward Ratio: Choose Trades Wisely
Always evaluate the risk-to-reward ratio to ensure that potential profits justify the risks involved before committing to any trade. A good benchmark is 1:2 or higher. That means if you’re risking ₹1000, you should be targeting at least ₹2000 in returns. Even with some losing trades, your winners can keep you profitable.
Use Stop-Loss and Take-Profit Orders
- Stop-loss: Automatically exits a trade if it drops below a certain level.
- Take-profit: Closes a trade once your target is reached.
These tools help take emotion out of trading decisions, offering disciplined execution to lock in profits and limit potential losses.
Rebalancing: Maintain Portfolio Health
As prices change, your original allocation might shift. For example, if an altcoin triples in value, it might now make up 40% of your portfolio instead of 20%. Rebalancing restores your portfolio to your preferred ratio and helps manage risk exposure effectively.
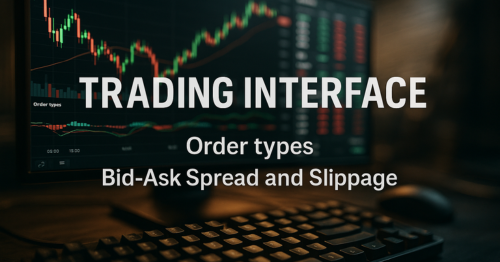
Understanding the Trading Interface
Stepping into the world of crypto trading can feel overwhelming, especially when you first open a trading platform. There are charts, numbers, buttons, and tables, all demanding your attention. To trade with confidence, it’s essential to understand how to navigate the trading interface, know the different order types, and be aware of how price mechanics like bid-ask spread and slippage work.
Let’s break it down so you can execute your trades smoothly and wisely.
Trading Interface
A crypto trading interface is the control panel where all your buying, selling, and chart analysis takes place. While each platform may look slightly different, whether it’s Binance, CoinDCX, WazirX, or KuCoin, the core components remain fairly standard.
Here are the key sections you’ll typically see:
Price Chart
This is where you view real-time market data through candlestick charts. You can change the time interval (e.g., 1 minute, 1 hour, 1 day) to match your strategy. Most charts are powered by TradingView and come with tools for drawing trend lines, adding indicators, and analyzing patterns.
Order Book
The order book shows live buy (bid) and sell (ask) orders placed by other traders. It’s split into two sides:
- Buy Orders (Green): Traders willing to buy at a specific price.
- Sell Orders (Red): Traders offering to sell at their chosen price.
Watching the order book gives you insight into current market demand and supply.
Market Depth
This displays the depth of market liquidity by showing how much buying and selling interest exists at various price points. A deeper market suggests more stable trading and tighter spreads.
Order Panel
This is where you place your trade. You’ll specify the amount of crypto you want to trade, select your preferred order type (we’ll cover those shortly), and then finalize the transaction.
Trade History
Displays recently executed trades. This section helps you gauge recent market activity and price movement.
Once you get used to these areas, placing trades becomes far more intuitive.
Order Types
Choosing the right order type is crucial for controlling when and how your trade gets executed. Here are the most common types:
Market Order
A market order buys or sells instantly at the current market price. It executes quickly, but in highly volatile markets, it may suffer from slippage, where the final price differs from what you expected.
- Best for speed
- Not ideal in illiquid or fast-moving markets
Limit Order
A limit order sets your desired price. The trade is triggered only when the market price hits your specified level, ensuring more control over entry or exit points.
- Best for price control
- No guarantee of execution
Stop-Loss Order
This tool triggers an automatic sell when the asset’s price drops below your preset threshold, helping to limit potential losses. It protects you from major losses in a falling market.
- Risk management tool
- May trigger prematurely in volatile conditions
Take-Profit Order
Similar to stop-loss, but it locks in profits. Your position closes when the price hits your profit target.
Most platforms also offer advanced types like OCO (One Cancels the Other) and Trailing Stop, but beginners should start with market and limit orders.
Bid-Ask Spread and Slippage
Understanding how prices are set and how your trade fits into the market flow is critical.
Bid-Ask Spread
Every asset has two main prices:
- Bid Price: The maximum amount a buyer is currently willing to pay for a cryptocurrency.
- Ask Price: The minimum price a seller is willing to accept for a cryptocurrency at that moment.
The spread is the difference between the two. For instance, if the bid price is ₹1,000 and the ask price is ₹1,005, the difference, known as the spread, is ₹5. A tight spread indicates high liquidity and is favorable for traders. Wider spreads may signal low demand or low volume.
Slippage
Slippage occurs when your trade is filled at a price that deviates from your intended entry or exit point, often due to market volatility or low liquidity. It often occurs in fast-moving markets or when large orders are placed.
For example, you place a market order to buy Bitcoin at ₹3,00,000. By the time it executes, the price might jump to ₹3,01,000. That ₹1,000 difference is slippage.
How to reduce slippage:
- Use limit orders instead of market orders.
- Trade during high-volume periods.
- Avoid placing large orders in low-liquidity markets.
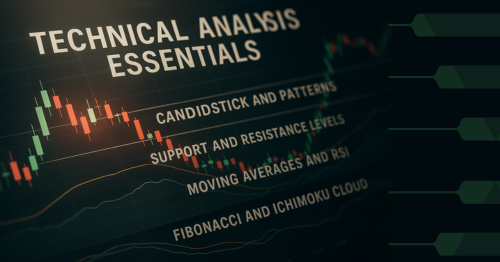
Technical Analysis Essentials
Technical analysis (TA) is a key skill every crypto trader must learn. At the same time, fundamental analysis evaluates a project’s underlying value and external news, and technical analysis (TA) zeroes in on price charts, trends, and indicators to predict future market behavior. Mastering TA, whether you’re dealing with Bitcoin, Ethereum, or altcoins, can significantly enhance your trading precision and timing.
This section will introduce the most essential components of technical analysis in crypto, perfect for beginners building their trading foundation.
Candlestick Charts and Patterns
Candlestick charts are the most widely used tool in crypto trading. Each candlestick represents price movement within a selected timeframe (e.g., 1 hour, 4 hours, 1 day). A single candle shows four key values:
- Open: Price at the start of the period
- High: Highest price reached
- Low: Lowest price during the period
- Close: Price at the end of the period
Types of Candles
- Bullish Candle (Green): Close is higher than open (price went up)
- Bearish Candle (Red): Close is lower than open (price went down)
Common Candlestick Patterns
- Doji: A candlestick pattern that indicates market indecision, where the opening and closing prices are nearly identical, often signaling a potential trend reversal.
- Hammer: A bullish reversal pattern after a downtrend.
- Engulfing Pattern: A strong reversal sign when one candle fully covers the previous one.
Recognizing these patterns can help you anticipate changes in market direction and act accordingly.
Support and Resistance Levels
These are key price levels where buying or selling pressure tends to emerge, often causing the market to pause, bounce, or reverse direction.
Support
This is a price level where demand is strong enough to prevent the price from falling further. Traders often buy here, expecting a bounce.
Resistance
This is where supply overtakes demand, stopping the price from rising further. Traders typically sell here, expecting a reversal or correction.
Why They Matter
Support and resistance levels help traders:
- Set entry and exit points
- Place stop-loss orders
- Identify breakout and breakdown zones
These zones aren’t exact lines, think of them as “areas” or “zones” rather than fixed prices.
Moving Averages and RSI
Indicators simplify price data and highlight trends that aren’t obvious to the naked eye. Two of the most beginner-friendly and widely used indicators are Moving Averages and the Relative Strength Index (RSI).
Moving Averages (MA)
A moving average smooths out price data by creating a line based on average prices over a set number of periods.
- Simple Moving Average (SMA): A technical indicator that calculates the average closing price of an asset over a specific time frame, such as a 50-day SMA, to help identify trend direction.
- Exponential Moving Average (EMA): Like the SMA, but places greater emphasis on recent prices, making it more sensitive to current market movements and quicker to signal trend changes.
How to use them:
- When the price crosses above the moving average: This is often seen as a bullish indicator, suggesting potential upward momentum or a trend reversal to the upside.
- When the price crosses below the moving average: This is typically viewed as a bearish signal, hinting at downward momentum or the start of a potential downtrend.
Combining two MAs (e.g., 50 EMA and 200 EMA) creates crossover strategies like the Golden Cross (bullish) or Death Cross (bearish).
Relative Strength Index (RSI)
This momentum oscillator gauges the speed and magnitude of recent price changes on a scale from 0 to 100, helping identify overbought or oversold conditions.
- Above 70: Overbought (possible correction ahead)
- Below 30: Oversold (potential rebound)
RSI helps spot potential trend reversals or confirm the strength of a current move.
Fibonacci and Ichimoku Cloud
Advanced traders use tools like Fibonacci retracement and the Ichimoku Cloud to find deeper insights into support, resistance, and trend direction.
Fibonacci Retracement
This tool is based on the idea that prices often retrace a predictable portion of a move before continuing. Key Fibonacci levels include:
- 38.2%
- 50%
- 61.8%
Traders draw Fibonacci lines from a swing high to a swing low to identify where price might reverse or consolidate. These levels frequently serve as key support or resistance zones, where price tends to stall, reverse, or consolidate before continuing its trend.
Ichimoku Cloud
Ichimoku is a multi-component indicator that gives a comprehensive view of:
- Trend direction
- Support/resistance
- Momentum
- Future price projections
It consists of five lines:
- Kijun-sen (Base Line)
- Tenkan-sen (Conversion Line)
- Senkou Span A & B (Cloud boundaries)
- Chikou Span (Lagging Line)
When price is above the cloud, the market is considered bullish. When it’s below the cloud, it’s bearish. If the price is inside the cloud, the market is indecisive or consolidating.
Though it may look complex, Ichimoku provides a powerful overview once understood, making it a favorite among seasoned traders
Conclusion: Your Journey from Basics to Strategy
Crypto trading may seem overwhelming at first, but with the right knowledge and a structured approach, it becomes far more manageable, and even empowering.
We began by exploring the core differences between trading and investing, followed by essential tools in financial market analysis and an overview of market dynamics. Understanding various financial instruments such as spot and derivatives gave you insight into how traders interact with the crypto ecosystem.
From there, we looked at trading strategies like day trading and swing trading, and emphasized the importance of asset allocation, diversification, and risk management. These principles form the backbone of any sustainable and secure trading plan.
Then, we navigated the trading interface, your command center for all trades. We broke down different order types and explained how bid-ask spreads and slippage affect execution prices in real time.
Finally, we dived into technical analysis, the most important skill for identifying market trends and timing your trades. Tools like candlestick patterns, support/resistance, moving averages, RSI, Fibonacci, and Ichimoku Cloud provide actionable insights when used with discipline and practice.
Frequently Asked Questions
What is the best strategy for beginners in crypto trading?
For beginners, swing trading is often the best starting point. It allows you to analyze trends over days or weeks without needing to monitor the market constantly. Combining it with proper risk management and technical analysis improves your chances of success.
How much money should I start with in crypto trading?
You can start trading crypto with as little as ₹500–₹2,000. It’s recommended to start small, especially when you’re learning, and only use money you can afford to lose. Focus more on building skills than on making quick profits.
Is crypto trading safe for beginners?
Crypto trading involves risks due to market volatility, scams, and poor risk management. However, with education, use of reputable exchanges, proper portfolio allocation, and disciplined strategies, it can be done safely.
Which technical indicators are best for new traders?
Beginners should start with Moving Averages, RSI (Relative Strength Index), and Support/Resistance levels. These are easy to understand and provide clear signals for entry and exit.
What is the difference between investing and trading in crypto?
Investing means holding crypto assets long-term to benefit from overall growth, while trading involves frequent buying/selling to profit from short-term price movements. Traders use technical analysis, while investors often rely more on fundamentals.